Space Utilization / Heat Mapping | IoT Technologies
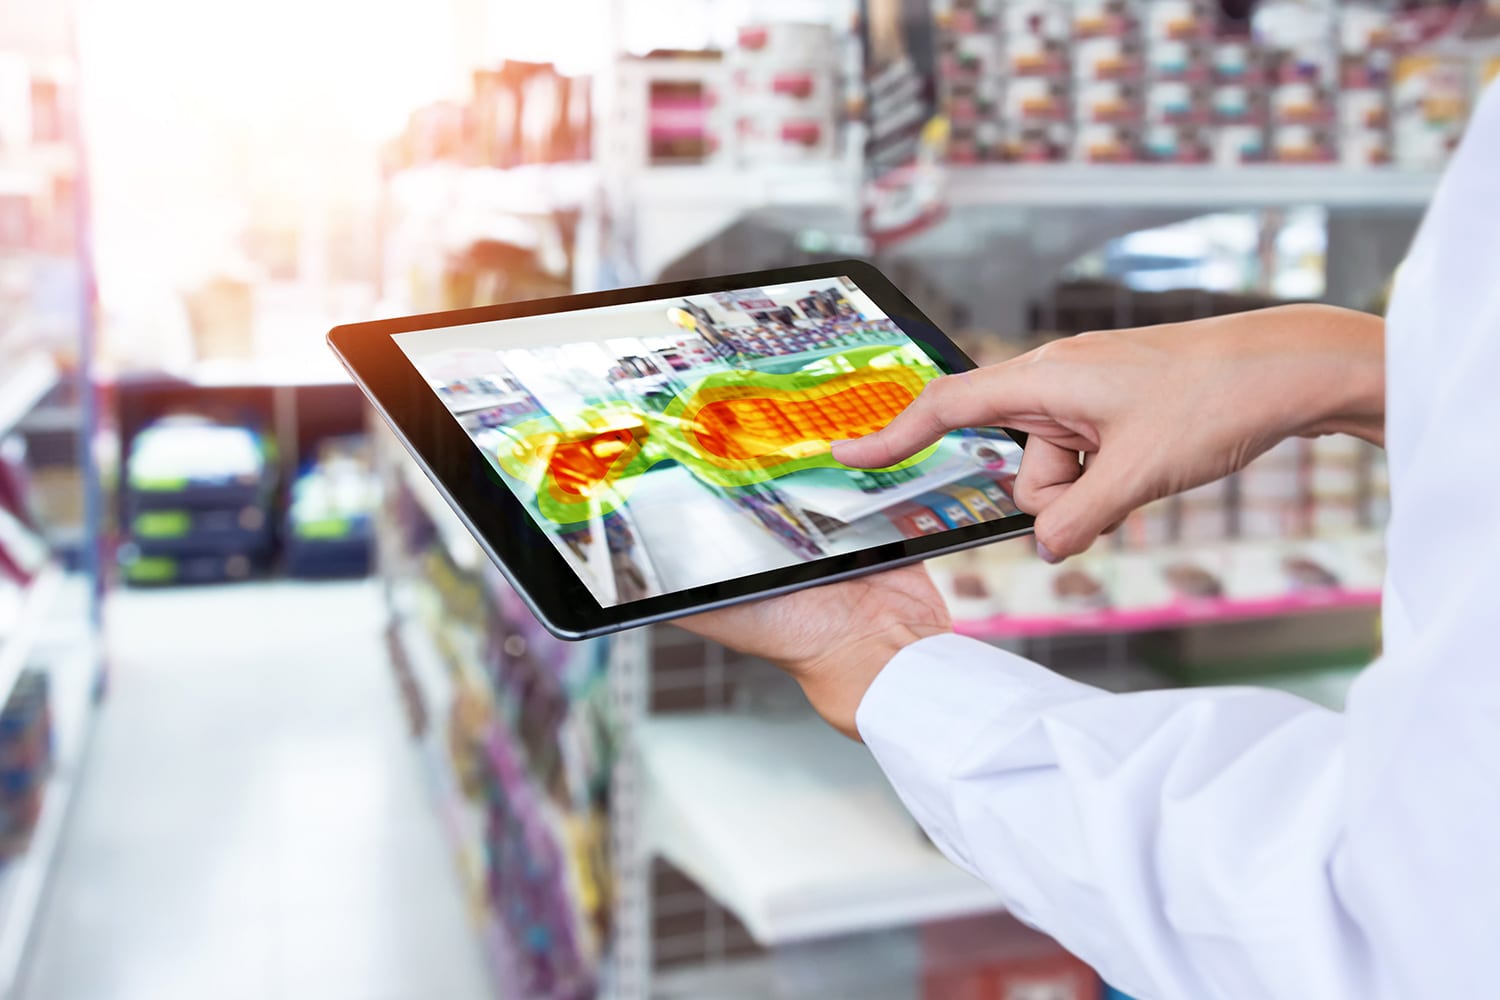
IoT-enabled technologies allow for comprehensive data collection, the data is then transferred and translated to create a heat map. A heat map (or heatmap) is a data visualization technique that shows magnitude of a phenomenon as color in two dimensions. The variation in color may be by hue or intensity, giving obvious visual cues to the reader about how the phenomenon is clustered or varies over space. There are two fundamentally different categories of heat maps: the cluster heat map and the spatial heat map. In a cluster heat map, magnitudes are laid out into a matrix of fixed cell size whose rows and columns are discrete phenomena and categories, and the sorting of rows and columns is intentional and somewhat arbitrary, with the goal of suggesting clusters or portraying them as discovered via statistical analysis. The size of the cell is arbitrary but large enough to be clearly visible. By contrast, the position of a magnitude in a spatial heat map is forced by the location of the magnitude in that space, and there is no notion of cells; the phenomenon is considered to vary continuously.
Space Utilization & Heat Mapping – Q&A
What are heat maps?
A heat map (or heatmap) is a graphical representation of data where values are depicted by color. Heat maps make it easy to visualize complex data and understand it at a glance.
What is a heat map used for?
A heatmap is a graphical representation of data that uses a system of color-coding to represent different values. Heatmaps are used in various forms of analytics but are most commonly used to show user behavior.
What is a heat map in business?
The heat map is one of the most useful and powerful data-analysis tools available in business intelligence. It is a visualization feature that presents multiple rows of data in a way that makes immediate sense by assigning different size and color to cells each representing a row.
Pain point(s) surrounding the need for space utilization & heat mapping:
Energy efficiency
Power consumption / waste
Employee health & safety
Solution(s) provided by our space utilization & heat mapping technologies:
Due to the ever-changing needs of business owners, space utilization & heat mapping software are constantly being added to the marketplace with more and more add-ons that are geared towards keeping everyone safe and healthy; contact us for the latest solution set for your business.
Applications
Facility management
Offices
Banks
Community / municipalities
Schools / universities
Daycare / assisted living facilities
Healthcare


Recent Comments